Rendering a 21,000-node graph in the browser
By Anchit Shrivastava ·
63,000 edges at 60fps on integrated graphics — no graph database, no server render farm. How Dhaga renders a whole knowledge graph client-side.
The short version
Dhaga turns your contacts and notes into a private knowledge graph. Power users have 20,000+ people, companies, and events in theirs, wired together by 60,000+ relationships. We render the whole thing, live, in a browser tab — you can pan, zoom, hover, and filter it at a smooth frame rate on an ordinary laptop. No graph database. No server-side render farm. No "loading your graph…" spinner that spins forever.
We got there by being ruthless about where each unit of work happens: the GPU draws, a background thread computes the layout once and we cache the result forever, and the main thread does almost nothing per frame. This post is how.
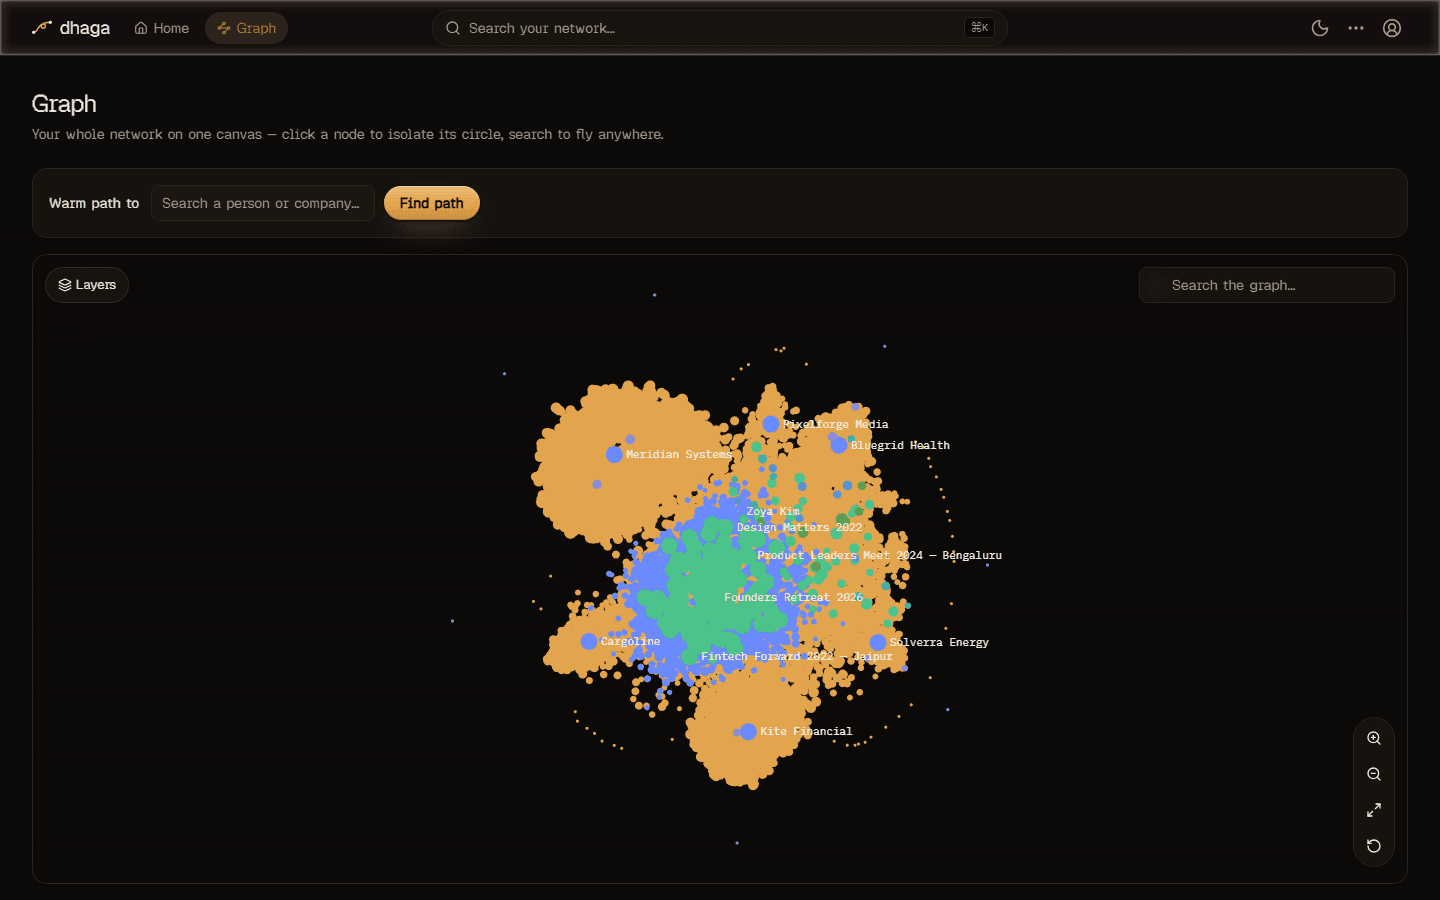
The rest of this post is the deep technical dive — the numbers we measured, the architecture we shipped, and the three or four decisions that made the difference. File paths refer to the real code.
The problem, stated precisely
A knowledge graph is only useful if you can see it. But "see it" at the scale our heaviest users hit is a genuine performance problem:
- ~21,000 nodes (contacts, companies, events, notes) and ~63,000 edges (works-at, attended, knows, mentioned-in).
- It has to be interactive: pan, zoom, hover-to-highlight-neighbours, click-to-isolate, filter by layer — all at a frame rate that doesn't feel broken.
- It has to work on mid hardware. Our reference machine for the numbers below is a laptop with an Intel UHD 620 integrated GPU — not a gaming rig.
- And it has to fit our architecture constraints: the graph is boring
relational Postgres (
contacts,companies,edges, …), not a graph database, and heavy compute should not live on a per-request serverless function we pay for by the millisecond.
The naïve version of this — fetch the graph, hand it to a chart library, let it lay out and render on the main thread — falls over an order of magnitude before we need it to.
What we rejected, and why
We benchmarked the obvious options before committing.
| Approach | Why it lost |
|---|---|
| React Flow / any DOM-node renderer | Every node is a DOM element. It became unusable somewhere around 2,000 nodes — layout thrash and scroll jank. We need 10× that. |
| Raw WebGL, hand-rolled | Total control, and genuinely fast — but a from-scratch renderer that only draws points is roughly 10× the code to reach feature parity (labels, edges, hover picking, zoom-aware sizing). Not worth it. |
| Server-side layout / image tiles | Moves the cost onto compute we pay for per request, kills interactivity, and fights the local-first grain of the product. |
The winner: sigma.js v3, which renders to WebGL, sitting on top of graphology as the in-memory graph model. Sigma gives us the GPU draw path and picking for free; graphology gives us a fast graph data structure. Everything hard is in how we feed them.
The rendering code lives under
apps/web/src/components/app/graph/:
GraphView
maps load phases to UI,
canvas/create-sigma.ts
constructs the renderer,
canvas/reducers.ts
holds the per-object styling logic, and
layout/fa2.worker.ts
runs the layout off-thread. One detail worth calling out early: the canvas is
loaded with next/dynamic and ssr: false,
because sigma touches window/WebGL at construction — it must be a client-only
chunk.
The core idea: move every kind of work off the hot path
The whole architecture is one principle applied four times. For each expensive thing — fetching, layout, styling, and per-frame work — ask "does this have to happen now, on this thread, again?" The answer is almost always no.
1. Fetch: the whole graph, once, then cache it three ways
We ship the entire graph in a single response from
GET /api/graph/full —
every node kind, every explicit edge, plus synthesized works_at/attended
edges, plus the user's saved layout. The client then computes degree, filtering,
and highlight sets locally. There is no pagination, no per-viewport
streaming query, no round trip when you pan.
That sounds expensive, and it would be if we re-assembled and re-sent it every time. So it's cached at three layers, each covering a different failure mode:
- Server cache, keyed by version — not by time.
getCachedFullGraphassembles the multi-table payload only when a cheap "graph version" aggregate has changed. This is the single heaviest read in the product; making it version-keyed instead of TTL-keyed means it's exactly as fresh as the data and no staler. - HTTP
ETag/304. The route setsETag: "<version>"and honoursIf-None-Match. An unchanged graph is a304 Not Modifiedwith an empty body — kilobytes, not megabytes. - Client IndexedDB, stale-while-revalidate.
payload-cache.tsstores the last payload and paints from it immediately on load, then revalidates in the background. A304means the instant paint was correct; a200silently swaps in fresh data. (Why IndexedDB and notlocalStorage? The payload is multiple MB;localStorage's ~5MB quota can't hold it. The IndexedDB row is also stamped with the user id and purged on mismatch — that guard closed a real cross-account instant-paint bug we caught in testing.)
The result: a returning user sees their graph paint from cache in milliseconds and revalidates invisibly.
2. Layout: ForceAtlas2, in a worker, computed once, cached forever
Positioning 21k nodes with a force-directed layout is the single most expensive computation in the whole feature. Running it on the main thread would freeze the tab for the entire settle time. So it doesn't run there.
layout/fa2.worker.ts
runs ForceAtlas2 in a web worker. The main thread only ever seeds the worker
and forwards progress — it never iterates. Node positions cross the worker
boundary as transferable typed-array buffers,
so there's no structured-clone copy of the whole graph on every message.
Inside the worker, several things keep it fast and responsive:
- Barnes–Hut approximation kicks in above 2,000 nodes — the standard O(n log n) trick that makes force-directed layout tractable at this scale.
- Chunked iteration with early exit. It runs ~10 iterations at a time, posts progress, and stops early when the mean per-node movement drops below a settle ratio. A graph that settles in 30 iterations doesn't pay for 300.
- An iteration budget that scales down as the graph grows. The cap is 300 iterations at ≤1k nodes, 200 at ≤5k, 120 at ≤20k, 80 beyond — because past a point more iterations stop visibly improving the layout.
Measured: ~50 iterations at 20k nodes costs about 6.7 seconds in the worker. That's a lot — which is exactly why we make sure it almost never runs.
The layout you never recompute. Once positions settle, we persist them to a
graph_layouts table
(one row per user, holding a hash of the graph and the positions as JSON), and
the saved layout rides along inside the /api/graph/full payload. On load we
resolve layout by a precedence ladder,
cheapest first:
| Tier | Condition | Cost |
|---|---|---|
| L1 exact | This device's local cache matches the current graph hash | Skip ForceAtlas2 entirely |
| L2 exact | The server-saved layout matches the hash | Skip FA2 — a returning user on a new device pays nothing |
| Warm start | A stale cache covers ≥90% of nodes | A short ~20-iteration refine; new nodes seeded at their neighbours' centroid |
| Cold | Nothing cached | Deterministic cluster seed + full FA2 |
New positions upload fire-and-forget, debounced by 2 seconds, so settling a fresh layout never blocks the UI. In practice the expensive cold path happens once, ever, for a given graph shape — everyone else lands on L1 or L2.
3. Styling: sigma reducers, and the gotcha that crashes if you're clever
Sigma styles every node and edge on each refresh by calling a reducer — a function that returns the visual attributes for that object (colour, size, dimmed-or-not, label-or-not). This is where hover-highlight, selection, isolate, and layer-filtering actually get expressed.
Two rules make this fast:
All dynamic state lives in one mutable ref, and a change is a set-swap — never
a rebuild. Hover, selection, the hidden-node set, the active path, collapsed
counts — all of it sits in a single RenderState object.
Filtering or hovering mutates that object and calls sigma.refresh({ skipIndexation: true }). We never re-bind reducers and never rebuild the
graphology graph. That's the perf contract, stated in the code.
Every lookup a reducer does is O(1), because we index the payload once. When
a payload arrives we build
nodeById, neighbors, degree, edgesByNode, groupMembers a single time.
So when you hover a node, computing "which nodes are its neighbours, and
therefore which everything-else should dim" is a set membership test, not a graph
traversal. The budget written into that file: hover < 16ms at 20k nodes — one
frame.
Now the gotcha. Sigma v3's reducer contract is that the object you return
replaces the node's attributes wholesale —
it is not merged. If any branch returns only what changed instead of spreading
the existing attributes first, sigma drops the node's x/y,
applyNodeDefaults throws "could not find a valid position (x, y)", and the
whole canvas dies. It's the kind of bug that's invisible until the one hover
state that takes the buggy branch. We have a
dedicated regression test
that asserts every key of the input appears in every reducer's output, with a
failure message that names the dropped key — so this can never regress silently.
4. Per-frame work: do as little as physically possible
Even with cheap reducers, calling them for 21k nodes + 63k edges on every mouse move is too much. The last layer of the design is about not running the reducers unless something visible actually changed.
Level of detail — stop drawing what nobody can read. Node labels below 8px
rendered size are skipped by sigma. Edge labels only appear once you've zoomed
in past a camera-ratio threshold — and crucially, we
flip that state only when the camera crosses the threshold,
by listening to the camera's updated event, not by checking every frame. Above
5,000 nodes we enable hideEdgesOnMove (edges aren't drawn mid-pan), and above
10,000 edges we disable edge click-picking entirely — both
configured at construction.
The hover gate — the single biggest win. This one came straight out of a
profiler. When you drag to pan, sigma fires enterNode/leaveNode for every
node that slides under the cursor — potentially hundreds in one gesture. Each
one was triggering a full reducer sweep.
The measured cost:
17.4 fps average, 2.1 fps at p5, a 583ms worst frame during a drag-pan.
The fix in
canvas/hover-gate.ts
is small and surgical: coalesce hover bursts with requestAnimationFrame — at
most one reducer sweep per frame, no matter how many events arrive; a burst
that nets out to "same node" flushes nothing; and while the pointer button is
down (you're panning, not hovering), suppress hover emphasis entirely. Hover
emphasis also bypasses React completely —
a ref write plus a cheap refresh, never a state update and re-render.
That gate took drag-pan from 17fps to 46fps at 63k edges. Same graph, same hardware — we just stopped doing pointless work.
The measured envelope
Everything above, on the Intel UHD 620 reference machine, 21k nodes / 63k edges:
| Scenario | Result |
|---|---|
| First-ever cold load (compute layout from scratch) | fetch 1–2s + layout ~16–23s (happens once, ever) |
| Returning user, new device (layout from DB) | TTI 1.28s |
| Warm load (everything cached) | 295ms |
| Drag-pan, after the hover gate | 46 fps (was 17) |
| Hover-highlight | < 16ms — one frame |
The cold path is slow and we're at peace with that: it's a one-time cost, it runs in a worker so the tab stays alive with a progress bar, and its output is cached to the DB so no other device ever pays it.
Knowing where the edge is
None of this scales forever, and pretending otherwise is how you ship a cliff.
The code has explicit
tripwires:
cross 50,000 nodes or 150,000 edges and it emits a console.warn saying the
full-load + client-side-layout architecture is out of headroom, and names what
comes next (server-side layout jobs, payload slimming, viewport streaming).
Nothing is silently truncated — the warning fires before the experience
degrades, not after. We'd rather see the wall coming than hit it in a user's
tab.
The tag layer — an optional overlay that can add hundreds of thousands of edges on pathological data — is not in the main payload for exactly this reason. It loads lazily, on demand, and under a hard edge budget, so a degenerate tag explosion can never take the core graph down with it.
The takeaways
If you're rendering a large graph — or really any large interactive dataset — in a browser, the transferable lessons:
- Pick where each unit of work runs, deliberately. GPU draws, a worker computes, the main thread coordinates. The library matters far less than the division of labour around it.
- Compute-once, cache-forever beats compute-fast. The layout is expensive; the winning move wasn't a faster layout, it was making it run essentially never (L1/L2 cache hits, persisted to the DB).
- Per-frame cost is death. The hover gate — coalescing events to one sweep per frame — was a bigger win than any algorithmic change. Profile the gesture, not just the load.
- Know your reducer's contract exactly. The "return a total object" footgun in sigma cost us a crash and bought us a regression test. Read the library's fine print for the hot path.
- Build the tripwire before you need it. A
console.warnat 50k nodes is three lines of code and the difference between "we know our limits" and "a user found them for us."
The whole pipeline sits under components/app/graph/ — fetch and cache, layout
worker, reducers, and the per-frame gates, in that order.
Discussion
The fan-out that killed the search
Six sources under one Promise.all, a pool of three: HTTP 500 with one user. Why Promise.all multiplies concurrency when every read takes a connection.
A schema that heals itself on cold start
No migration tool and a 15-second sign-in. How one content hash turned a full schema replay on every serverless cold start into a self-healing no-op.